共 1 条评论关于"快速在vue项目中使用vue-echarts图表插件"


最新评论
其实网上这种文章很多,主要是之前在百度过程中发现很多帖子多少都有问题各种掉链子,所以在此记录下正确使用的入门姿势,方便自己也方便大家快速引入使用,毕竟使用插件,那就是要明显提升项目速度才行。
vue-cli2.x全家桶,"vue": "^2.3.3","echarts": "^4.7.0","vue-echarts": "^5.0.0-beta.0"
1 | npm install echarts vue-echarts |
注意,很多帖子说的就直接安装vue-echarts,而事实上仅仅安装vue-echarts新版本并不适用,一定要同时安装echarts
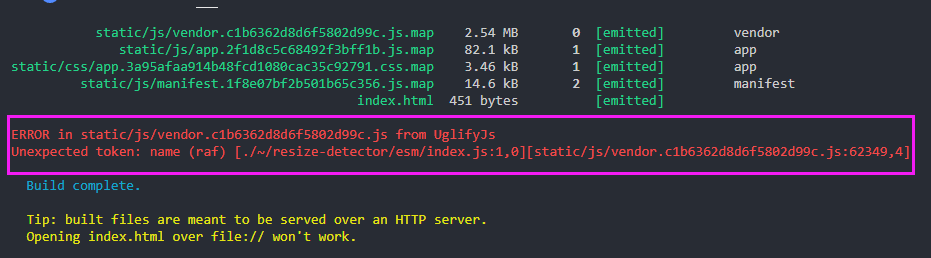
该处如果不配置,打包上线后就没经过babel可能会存在如下截图问题,具体配置如下:
打包报错信息:ERROR in static/js/vendor.c1b6362d8d6f5802d99c.js from UglifyJs
Unexpected token: name (raf) [./~/resize-detector/esm/index.js:1,0][static/js/vendor.c1b6362d8d6f5802d99c.js:62349,4]
1 2 3 4 5 6 7 8 9 10 11 | { test: /\.js$/, loader: 'babel-loader', // include: [resolve('src'), resolve('test')] //修改此段代码,如下: include: [ resolve('src'), resolve('test'), resolve('node_modules/vue-echarts'), resolve('node_modules/resize-detector') ] }, |
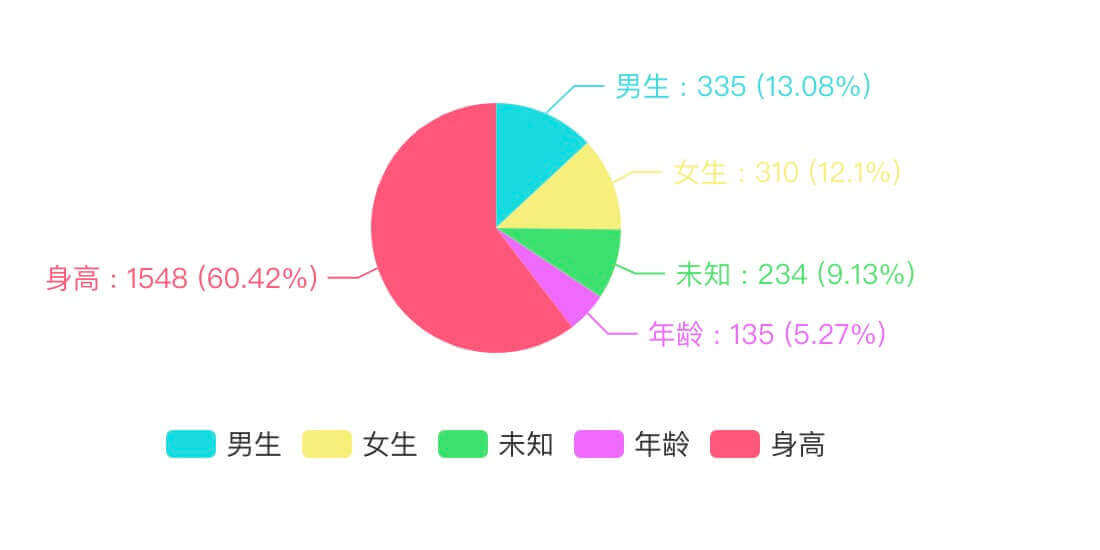
1 2 3 4 5 6 7 8 9 10 11 12 13 14 15 16 17 18 19 20 21 22 23 24 25 26 27 28 29 30 31 32 33 34 35 36 37 38 39 40 41 42 43 44 45 46 47 48 49 50 51 52 53 54 55 56 57 58 59 60 61 62 63 64 65 66 67 68 69 70 71 72 73 74 75 76 77 78 79 80 81 82 83 84 85 86 87 88 89 90 91 92 93 94 95 96 97 98 99 100 101 102 103 104 105 106 107 108 109 110 111 112 113 114 115 116 117 118 119 120 121 122 123 124 125 126 127 | //组件中 <template> <div class="content"> <v-chart :options="options" :auto-resize="true"/> </div> </template> <script> import ECharts from 'vue-echarts' // 饼状图 import 'echarts/lib/chart/pie' // 折线 import 'echarts/lib/chart/line' // 柱状图 import 'echarts/lib/chart/bar' // 提示 import 'echarts/lib/component/tooltip' // 图例 import 'echarts/lib/component/legend' // 标题 import 'echarts/lib/component/title' export default { components: { 'v-chart': ECharts }, //局部注册 data() { return { options: {} } }, mounted() { this.options = { // 标题 title: { text: '测试demo', x: 'center', textStyle: { color: '#fff', fontSize: 18, fontWeight: 'normal' } }, // 工具提示 tooltip: { trigger: 'item', formatter: '{a} <br/>{b} : {c} ({d}%)' }, // 图例说明 legend: { show: true, x: 'center', bottom: 30, data: ['男生', '女生', '未知', '年龄', '身高'], textStyle: { //底部一排按钮 color: '#333', fontSize: 14 } }, // 各个部分的颜色 color: ['#18DBDF', '#F6EF7B', '#3DE16F', '#EF69FB', '#FE5679'], // 拖拽的时候重新渲染 默认关闭 calculable: true, // 工具箱 toolbox: { show: true, feature: { mark: { show: true }, dataView: { show: true, readOnly: false }, magicType: { show: true, type: ['pie', 'funnel'], option: { funnel: { x: '25%', width: '50%', funnelAlign: 'left', max: 1548 } } }, restore: { show: true }, saveAsImage: { show: true } } }, label: { show: true, fontSize: 14 }, series: [ { itemStyle: { normal: { label: { show: true, formatter: '{b} : {c} ({d}%)' }, labelLine: { show: true } } }, name: '访问来源', // 类型:这里是饼图 type: 'pie', radius: '50%', //修改饼图大小 center: ['50%', '40%'], // 数据 data: [ { value: 335, name: '男生' }, { value: 310, name: '女生' }, { value: 234, name: '未知' }, { value: 135, name: '年龄' }, { value: 1548, name: '身高' } ] } ] } } } </script> <style scoped> .content >>> .echarts { width: 600px; height: 250px; } </style> |
1 2 3 4 | //main.js中 import ECharts from 'vue-echarts' import 'echarts/lib/chart/line' Vue.component('v-chart', ECharts) |
1 2 3 4 5 6 7 | //组件中 <template> <div class="hello"> <v-chart ref="chart1" :options="option" :auto-resize="true"></chart> </div> </template> //为了代码简洁,option内部配置可参考方式一配置 |
图表自适应 :auto-resize="true" 偶尔不起作用,可添加属性autoresize解决,例如:
1 2 3 | <div class="echarts_box"> <v-chart :options="item" :auto-resize="true" autoresize /> </div> |
上一篇:认识IntersectionObserver交叉口观察者(懒加载、预加载)
最新评论
支付宝扫一扫打赏

微信扫一扫打赏

电话支持
173xxxx7240在线交流
微信添加

不错哦,学习了